Functional Loan Calculator

I am trying to work on projects that I am not that good at, so that I could become a better Java programmer.  So I decided to work on a GUI to create a loan calculator that determines how many months it would take to pay off a loan.  What I built here is very basic and doesn’t look pretty as a GUI, but it works!
When it comes to building the GUI I wasn’t concerned with coding that part myself as I am not concerned with design, and I could just use the NetBeans GUI creator to do it for me.  What I wanted practice doing was using inner classes and in using more algorithms.  If you are a coder and are reading this feel free to leave comments on any improvements you can see.

package LoanCalc;

import java.awt.event.ActionEvent;
import java.awt.event.ActionListener;

import javax.swing.JButton;
import javax.swing.JFrame;
import javax.swing.JLabel;
import javax.swing.JPanel;
import javax.swing.JTextField;

public class Practice {

public static void main(String [] args){

BuildGUI gui = new BuildGUI();
gui.setDefaultCloseOperation(JFrame.EXIT_ON_CLOSE);
gui.setVisible(true);

}
}

class BuildGUI extends JFrame implements ActionListener{
private JLabel[] l;
private JTextField []t;
private JTextField k;
private JPanel p;
private JButton b;
private String []Labels={“Debt Type”, “Total Owed”, “Interest Rate”, “Monthly Payment”, “Total Months”};

public BuildGUI(){

t=new JTextField[5];
l=new JLabel[5];
p=new JPanel();
b=new JButton();

for(int i=0;i<Labels.length;i++){
t[i]=new JTextField(20);
l[i]=new JLabel(Labels[i]);
p.add(l[i]);
p.add( t[i] );
//t[i].addActionListener(this);

}
b.setText(“Calculate”);
k=new JTextField();
b.addActionListener(this);

javax.swing.GroupLayout jPanel1Layout = new javax.swing.GroupLayout(p);
p.setLayout(jPanel1Layout);
jPanel1Layout.setHorizontalGroup(
jPanel1Layout.createParallelGroup(javax.swing.GroupLayout.Alignment.LEADING)
.addGroup(javax.swing.GroupLayout.Alignment.TRAILING, jPanel1Layout.createSequentialGroup()
.addContainerGap(javax.swing.GroupLayout.DEFAULT_SIZE, Short.MAX_VALUE)
.addComponent(b)
.addGap(104, 104, 104))
.addGroup(jPanel1Layout.createSequentialGroup()
.addGap(18, 18, 18)
.addGroup(jPanel1Layout.createParallelGroup(javax.swing.GroupLayout.Alignment.LEADING)
.addGroup(jPanel1Layout.createSequentialGroup()
.addGap(28, 28, 28)
.addGroup(jPanel1Layout.createParallelGroup(javax.swing.GroupLayout.Alignment.TRAILING)
.addComponent(l[1])
.addComponent(l[0]))
.addGap(68, 68, 68)
.addGroup(jPanel1Layout.createParallelGroup(javax.swing.GroupLayout.Alignment.LEADING, false)
.addComponent(t[0], javax.swing.GroupLayout.DEFAULT_SIZE, 138, Short.MAX_VALUE)
.addComponent(t[1])))
.addGroup(jPanel1Layout.createSequentialGroup()
.addGroup(jPanel1Layout.createParallelGroup(javax.swing.GroupLayout.Alignment.LEADING)
.addGroup(jPanel1Layout.createParallelGroup(javax.swing.GroupLayout.Alignment.TRAILING)
.addComponent(l[2])
.addComponent(l[3]))
.addComponent(l[4]))
.addGap(40, 40, 40)
.addGroup(jPanel1Layout.createParallelGroup(javax.swing.GroupLayout.Alignment.LEADING)
.addComponent(t[4], javax.swing.GroupLayout.PREFERRED_SIZE, 139, javax.swing.GroupLayout.PREFERRED_SIZE)
.addComponent(t[2], javax.swing.GroupLayout.PREFERRED_SIZE, 139, javax.swing.GroupLayout.PREFERRED_SIZE)
.addComponent(t[3], javax.swing.GroupLayout.PREFERRED_SIZE, 138, javax.swing.GroupLayout.PREFERRED_SIZE))))
.addContainerGap(62, Short.MAX_VALUE))
);
jPanel1Layout.setVerticalGroup(
jPanel1Layout.createParallelGroup(javax.swing.GroupLayout.Alignment.LEADING)
.addGroup(jPanel1Layout.createSequentialGroup()
.addGroup(jPanel1Layout.createParallelGroup(javax.swing.GroupLayout.Alignment.LEADING)
.addGroup(jPanel1Layout.createSequentialGroup()
.addGap(18, 18, 18)
.addComponent(t[0], javax.swing.GroupLayout.PREFERRED_SIZE, javax.swing.GroupLayout.DEFAULT_SIZE, javax.swing.GroupLayout.PREFERRED_SIZE))
.addGroup(javax.swing.GroupLayout.Alignment.TRAILING, jPanel1Layout.createSequentialGroup()
.addContainerGap()
.addComponent(l[0])))
.addPreferredGap(javax.swing.LayoutStyle.ComponentPlacement.UNRELATED)
.addGroup(jPanel1Layout.createParallelGroup(javax.swing.GroupLayout.Alignment.LEADING)
.addComponent(l[1])
.addComponent(t[1], javax.swing.GroupLayout.PREFERRED_SIZE, 20, javax.swing.GroupLayout.PREFERRED_SIZE))
.addPreferredGap(javax.swing.LayoutStyle.ComponentPlacement.UNRELATED)
.addGroup(jPanel1Layout.createParallelGroup(javax.swing.GroupLayout.Alignment.BASELINE)
.addComponent(t[3], javax.swing.GroupLayout.PREFERRED_SIZE, javax.swing.GroupLayout.DEFAULT_SIZE, javax.swing.GroupLayout.PREFERRED_SIZE)
.addComponent(l[2]))
.addPreferredGap(javax.swing.LayoutStyle.ComponentPlacement.UNRELATED)
.addGroup(jPanel1Layout.createParallelGroup(javax.swing.GroupLayout.Alignment.LEADING)
.addComponent(t[2], javax.swing.GroupLayout.PREFERRED_SIZE, javax.swing.GroupLayout.DEFAULT_SIZE, javax.swing.GroupLayout.PREFERRED_SIZE)
.addComponent(l[3], javax.swing.GroupLayout.PREFERRED_SIZE, 20, javax.swing.GroupLayout.PREFERRED_SIZE))
.addGap(18, 18, 18)
.addComponent(b)
.addGap(18, 18, 18)
.addGroup(jPanel1Layout.createParallelGroup(javax.swing.GroupLayout.Alignment.BASELINE)
.addComponent(l[4])
.addComponent(t[4], javax.swing.GroupLayout.PREFERRED_SIZE, javax.swing.GroupLayout.DEFAULT_SIZE, javax.swing.GroupLayout.PREFERRED_SIZE))
.addContainerGap(91, Short.MAX_VALUE))
);

javax.swing.GroupLayout layout = new javax.swing.GroupLayout(getContentPane());
getContentPane().setLayout(layout);
layout.setHorizontalGroup(
layout.createParallelGroup(javax.swing.GroupLayout.Alignment.LEADING)
.addGroup(layout.createSequentialGroup()
.addComponent(p, javax.swing.GroupLayout.PREFERRED_SIZE, javax.swing.GroupLayout.DEFAULT_SIZE, javax.swing.GroupLayout.PREFERRED_SIZE)
.addGap(0, 67, Short.MAX_VALUE))
);
layout.setVerticalGroup(
layout.createParallelGroup(javax.swing.GroupLayout.Alignment.LEADING)
.addGroup(layout.createSequentialGroup()
.addContainerGap()
.addComponent(p, javax.swing.GroupLayout.PREFERRED_SIZE, javax.swing.GroupLayout.DEFAULT_SIZE, javax.swing.GroupLayout.PREFERRED_SIZE)
.addContainerGap(60, Short.MAX_VALUE))
);

pack();
}

//setting text fields to floats
String dt;
String to;
String mp;
String i;

float totalOwed;
float monthlyPayment;
float interest;
int months;

public void actionPerformed(ActionEvent e) {

// Execute when button is pressed
//System.out.println(“You clicked the button”);

dt = t[0].getText();
to = t[1].getText();
mp = t[2].getText();
i = t[3].getText();
totalOwed = Float.parseFloat(to);
monthlyPayment = Float.parseFloat(mp);
interest = Float.parseFloat(i);
while (totalOwed > 0){

//for loop simulates a year
for(int i=0; i<=11; i++){
//break from loop if paid off!
if (totalOwed <= 0){
break;
}
totalOwed -= monthlyPayment;
//counter for months
months ++;
}

//adding interest
totalOwed = totalOwed + (totalOwed*interest);

}

String monthTotal = Integer.toString(months);
t[4].setText(monthTotal);

}

}
Cubs CRC and ideal lineup for this week

Here are the starters sorted by CRC, as you can see, they are also no different from OPS this week:

Name BA OBP SLG OPS CRC
Anthony Rizzo* 0.333 0.463 0.598 1.061 1.15287
Miguel Montero* 0.301 0.418 0.507 0.924 1.01014
Kris Bryant 0.275 0.411 0.451 0.861 0.93557
Addison Russell 0.267 0.295 0.453 0.748 0.83621
Jorge Soler 0.271 0.329 0.411 0.74 0.82743
Dexter Fowler# 0.262 0.345 0.397 0.742 0.82197
Starlin Castro 0.279 0.3 0.368 0.668 0.7679
Chris Coghlan* 0.202 0.275 0.394 0.669 0.72385

What I have noticed is that Castro has really slumped as of late, and although he seems to produce in RBI situations his overall contribution to runs has declined, while Russell’s has increased.  So this may be the time to see what Russell could do in the 5-6 hole instead of Castro.

The 2-3-4 (if pitcher bats 8th), or the 3-4-5 hitters(if pitcher bats 9th), should be Rizzo, Bryant and Montero (how about that free agent signing?).

So ideally you would like to reward guys for how they are performing by putting Soler and Russell in the 5-6 slot, Coghlan 7th, and Castro 9th.  Let this team play itself into the lineup positions they are earning.

Inner Classes, GUI’s, and a loan generator app.

In my attempt to learn as many things as possible this summer to become more employable I am trying to create an app that figures out the total months it would take to pay off a debt or loan given the premium, interest rate, and monthly payment.  I came to this idea because I think it would be a good tool for those that are budgeting like myself and it would be a great way to learn a few things in programming and get more practice.

So I am going to post my progress every Monday.  Right now I have built a template for the inner class build that I am using for the TextFields I am using.  I am going to have to spend this week trying to find a way to store the types of debt (debtName) and how to use the submit button to calculate the total months and have it displayed in a text field.

package DebtManager;

import java.awt.event.ActionEvent;
import java.awt.event.ActionListener;

import javax.swing.JButton;
import javax.swing.JFrame;
import javax.swing.JTextField;

public class Practice extends JFrame{

//button member declaration needed here

JTextField textField = new JTextField();
JButton button1 = new JButton();

class Handler implements ActionListener
{

float b;

@Override
public void actionPerformed(ActionEvent e) {

String a;

try {
if (textField.getText().isEmpty()){
throw new Exception();
}

a = textField.getText();
b = Float.parseFloat(a);
//jButton1ActionPerformed(owed);
}
catch (Exception e1){
System.out.println(b + ” field Left Blank”);
}

}
}

//Define an inner member class for each Text Field
protected void buildGUI()
{

//initialize the text fields

JTextField debtName = new JTextField(10);
JTextField TOwed = new javax.swing.JTextField();
JTextField interest = new javax.swing.JTextField();
JTextField monthly = new javax.swing.JTextField();

//Submit button needs method to do math, and send result to totalMonths
JButton submit = new javax.swing.JButton();

JTextField totalMonths = new javax.swing.JTextField();

//register inner class action listener for each button

//need separate method for debtName to just keep name as String
debtName.addActionListener(new Handler());

TOwed.addActionListener(new Handler());
interest.addActionListener(new Handler());
monthly.addActionListener(new Handler());

//need a separate method in handler for this.
totalMonths.addActionListener(new Handler());

}

}

The preferred Cubs lineup arranged by CRC and OBP

The Correlated Run Contribution stat is a stat I invented to help further evaluate how well a hitter is performing.  It helps to use this stat and OBP to help determine who should hit where in a lineup.  For example, a high OBP guy should be hitting 1 or 2 or 9 in the Cubs lineup, to get on base for the 3, 4 and 5 hitters who should have higher averages versus higher OBP’s.

So I have arranged an ideal lineup based on this philosophy.

The two best OBP guys on the team are Bryant and Rizzo, but they are also two of the highest Avg guys as well, and also two of the premier power hitters, so because of the latter you want to make them 3,4,5 hitters, but in Rizzo’s case he is a great base runner as well, which makes more sens to bump him up to the two hole.

The next highest OBP guy is Montero, but we all know he lacks speed and he also hasn’t done this well throughout his career.  But three guys behind him are all at .333 in OBP and that is Castro, Fowler, and Soler.  So it makes it easier now to put Fowler there (leadoff) as his history has shown him to approach .360 OBP and ideal speed, so you place him at leadoff.

That puts us with Fowler and Rizzo in the 1 and 2 holes.

In the three hole you want to start putting more premium on AVG and on power, right now that guy is Bryant, although he hasn’t hit a homer yet, you know that he is the best power bat on the team, so he takes up the three hole.  So right now you have 3 of the top 4 OBP guys taking up the 1, 2, and 3 spots.

In the fourth spot and 5th spot you want more premium on AVG and power again to help drive in those high OBP guys, this is where I put in Soler 4th and Montero 5th (ahead of Castro because he bats left).  And thus Castro is placed 6th.

That leaves a toss up between Russell and Coghlan to play the 7th or 9th spot.  Right now Russell hasn’t proven yet to show he can get on base like Coghlan has so I would switch him to the 7th spot and put Coghlan 9th (Coghlan has better history of getting on base).

So the lineup looks like this:

Name Age BA OBP SLG OPS CRC
Dexter Fowler 29 0.263 0.333 0.379 0.712 0.79571
Anthony Rizzo 25 0.313 0.458 0.53 0.988 1.0724
Kris Bryant 23 0.291 0.458 0.382 0.84 0.91964
Jorge Soler 23 0.266 0.333 0.404 0.738 0.82107
Miguel Montero 31 0.298 0.373 0.491 0.864 0.95589
Starlin Castro 25 0.303 0.33 0.374 0.704 0.81332
Chris Coghlan 30 0.214 0.276 0.429 0.705 0.76502
Addison Russell 21 0.233 0.25 0.442 0.692 0.76744

Notice how putting a premium on AVG, in your 2-6 slots you end up getting the best CRC guys planted there by design (Bryant’s CRC will soar once he hits a few homers).  You want more of an emphasis on AVG if you have similar players in OBP to bat in the spots behind your high OBP guys because higher AVG means driving in more runs and puts those guys in more RBI situations.

League leaders in CRC as of 5/1

The rank on the left will reflect their OPS rank, so you can see how OPS ranks people higher because of OBP.  The CRC corrects for batting average having more contribution to runs if a players OBP or OPS is similar to anothers:

1 Adrian Gonzalez* 1.36232
2 Adam Jones 1.29899
5 Matt Carpenter* 1.22565
4 Miguel Cabrera 1.2254
3 Nelson Cruz 1.21068
6 Joey Votto* 1.17425
9 Joc Pederson* 1.15965
8 Mike Trout 1.14923
10 Stephen Vogt* 1.14622
7 Paul Goldschmidt 1.14551
11 Devon Travis 1.13394
19 Giancarlo Stanton 1.12824
15 Hanley Ramirez 1.12043
20 Jose Iglesias 1.10807
16 Matt Holliday 1.10457
13 Corey Dickerson* 1.10392
17 Adam Lind* 1.09649
12 Mike Moustakas* 1.09455
22 Jed Lowrie# 1.07566
14 Bryce Harper* 1.07117
28 Jose Abreu 1.07
18 DJ LeMahieu 1.06337
21 Alex Gordon* 1.05449
29 Kole Calhoun* 1.04454
23 Dee Gordon* 1.03823
26 Josh Donaldson 1.03741
27 Lucas Duda* 1.02927
25 Anthony Rizzo* 1.02561
35 Troy Tulowitzki 1.00406
30 Freddie Freeman* 1.00265
34 Nolan Arenado 1.00102
31 Howie Kendrick 1.00088
24 Mark Trumbo 0.99094
36 Yoenis Cespedes 0.98611
40 Pablo Sandoval# 0.97812
38 Kendrys Morales# 0.97587
33 Jose Altuve 0.97508
39 Todd Frazier 0.973
41 Eric Hosmer* 0.97175
43 Alex Rodriguez 0.96761
32 Lorenzo Cain 0.96326
48 Matt Adams* 0.96209
46 Chris Davis* 0.95252
44 Dustin Pedroia 0.94772
49 Colby Rasmus* 0.94723
37 Mark Teixeira# 0.9419
42 Justin Upton 0.93883
45 Logan Forsythe 0.93546
47 Matt Kemp 0.93299

Correlated Run Contribution

I do believe I have settled on a name for what I want to call this correlation stat for an at bat instance.  It comes with finding how the leagues batting average, on base percentage, and slugging percentages correlates with average earned runs per nine innings (ERA).  In the previous post I had shown how little batting average correlates with earned run average and am going to cover how on base, and slugging percentages correlate with ERA.

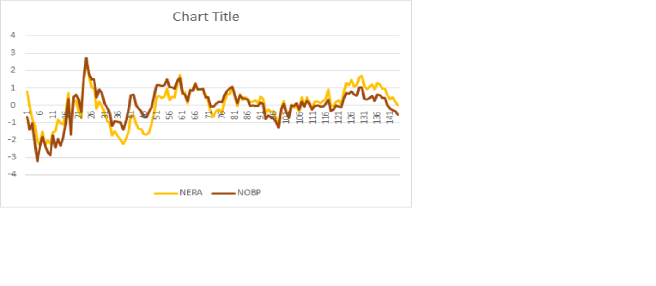
OBP graphIn the above graph it is hard to determine how much on base percentage correlates to earned runs but that is why Excel has the handy correlation coefficient.  So for the stat that I created I found the correlation to be at .83, which is much higher than what batting average was, which is not surprising in the least.

Now let’s take a look at slugging percentage:

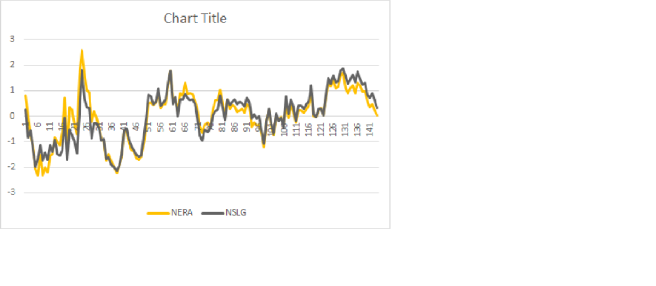
SluggingSlugging percentage when combined with ERA on a graph makes it almost look like an exact correlation, and it almost is with a correlation coefficient of .94, and if I were to graph OPS it would show a correlation of .97, which is statistically significant.  So what to do with all these correlations?

I ended up just taking a batting average, an on base percentage and a slugging percentage and multiplying them by it’s correlation coefficient, thus reducing them to it’s true effect on creating a run, and then I added all those percentages up to get what I call the correlated run contribution.

So in the national league the league leaders in 2014 looked like this:

Andrew McCutchen                    1.04
Giancarlo Stanton                       1.03
Anthony Rizzo*                            .99
Justin Morneau*                          .97
Buster Posey                                  .96
Yasiel Puig                                     .95
Matt Kemp                                    .94
Josh Harrison                              .943
Jayson Werth                               .935
Jonathan Lucroy                         .933

If you were to rank the top ten hitters by OPS, a few guys would shift around here, Puig would be ahead of Posey and Morneau, and Freddie Freeman would have knocked out Lucroy of the top ten here.  So what is the difference?  The slight advantage a hitter has in batting average, so if a hitter had a higher batting average but lower OPS there were times where the .62 correlated run contribution made a large enough difference to be more valuable than getting on base.

This is the kind of result I had intended to see when creating this stat, as I thought that although OPS had an incredibly high correlation to runs being created, it did leave out the anomalous hitters who hit for high contact and thus have higher batting averages.  So in some cases, some hitters that hit for higher average, but draw fewer walks can indeed contribute more to a run scored than a guy who hits for a lower average but walks more, of course they would have to be very close to each other in OPS for the contact hitter to jump ahead.  Thus if you are GM and you had two similar OPS hitters in free agency and needed a 3-5 hitter you would probably want the guy who had a higher CRC, and if you were looking for a 1-2 hitter a guy with higher OPS.

My New Correlation Stat with no Name

So I am trying to find out which batting instances contribute the most to creating runs.  Right now I am playing around with it just to see what kind of correlation coefficient I get.  Which tries to show how much an instance contributes to a higher ERA, which I am using ERA because it is the best way for me to measure runs minus any errors.  Maybe I will change that method as well as time goes on and I play with this more.

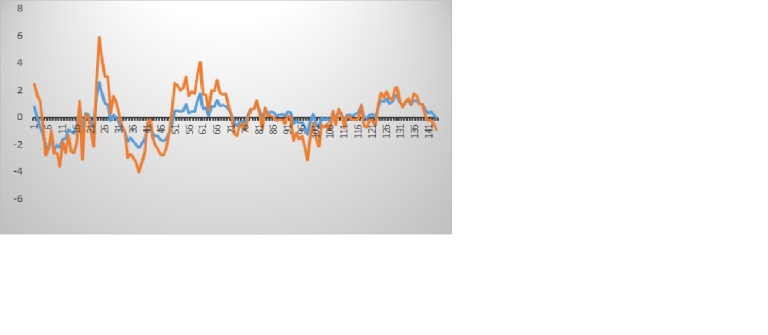
But here is my very first correlation using batting average per year and earned run average per year, league wide.  Surprisingly batting average only has a correlation of .621, which typically a strong correlation wants to be near .90 or higher to be significant.

Now when you plot batting average and earned runs on a graph, with the data normalized they do appear to have a connection, just not significant enough.

The orange line is batting average and blue line is ERA.  Because I am new with Excel graphs and with MSPaint features, this graph looks pretty anemic, and I promise as I do this more often my skills will improve in that regard, but you can get the general idea here.

BAERA My intent after running this through several different statistical categories like batting average, OBA, OPS, Slugging, etc…  Is to find out which instances have the highest correlations to earned runs and to add a weighted number to each instance and come up with a new stat!  We will see how this goes.   Also I am taking ideas on a name for this stat, please leave any suggestions via comments or email.


Artificial Intelligence

I had to write a paper on Artificial Intelligence and since I don’t like to waste my writing I figured I would also put it on my blog.

Artificial Intelligence


There are many different types of jobs one can do if interested in the artificial intelligence field.  I will try to cover the 5 most popular careers and perhaps touch on a few others.  Technically speaking, AI is a field and not yet a discipline, like programming.  AI is built upon a knowledge of mathematics and numerous other sciences, in order to detect, assess and act on information.  Most positions in the field require a masters or a PhD, with a strong emphasis on mathematical capabilities.  That being said the most popular jobs in this area are game programmers, robotic scientists, face recognition software, search engines, and government employees in the defense industry.


Game Programming  

http://www.raywenderlich.com/24824/introduction-to-ai-programming-for-games

https://software.intel.com/en-us/articles/designing-artificial-intelligence-for-games-part-1


In game programming you typically have to battle, compete, defend, strategize or defeat an enemy.  In order to make this enemy difficult and to make the game challenging and fun it has to have some form of intelligence to attempt to outwit you.  Programmers have to create algorithms to have enemies move in a way that counters your moves, or use seeking algorithms to find your position.


The average gamer has about 13 years of experience and typically plays a game because it is a challenge, so each new generation of games has to develop better AI in order to capture the attention of gamers.  Most games have a general set of rules that the AI adheres to and sticks to a certain chain of events or a script, so there isn’t much programming needed to go off script or against the determined rules.


Most characters in a game are determined by finite states, such as idle, aware, aggressive, alert and fleeing.  These states are activated by the human controlled player, and can be activated by checking for a certain variable.  There is also reliance on predictive algorithms that are used in conjunction with collecting history on a human controlled player to predict the next move.


When it comes to AI characters in games they need the ability to perceive and find paths, to give them another level of intelligence.   Sight is done with vectors, distance and angles, and if something is not within a certain angle the character doesn’t react to it.  Sound is done in a similar way as well.  Once you master sound and sight you can have enemies perform tasks such as cover, crash, and turn.  And after they have those tasks you can then create an algorithm to find the best path available to get from a starting position to an end position.


When it comes to finding jobs in the gaming industry it is best to move to an area of the country that has a high concentration of these companies.  There was a time when I lived in Austin, TX and noticed that they had a very large amount of these types of jobs comparable to other metropolitan areas.  If ou look on LinkedIn there are about 400 opening countrywide in this field:

https://www.linkedin.com/job/game-programmer-jobs/


Robotic Scientists

http://science.howstuffworks.com/robot6.htm

As I write this artificial intelligence in robots is still far away from trying to achieve the intelligence that humans have, with the ability to learn anything, ability to reason, ability to learn languages and formulate original ideas.  But they have made a lot of progress and can replicate some elements of intelligent ability.  The most basic robotic intelligence relies on gathering facts about a situation through sensors and human input.  the computer then compares this information to stored data and decides what the information means.  Then the computer runs through possible actions and decides which action will be the most successful.


Modern robotics has the capacity to learn in limited ways.  They can recognize if a certain action was successful or not, and store that information for the next time they attempt a certain action  Some can even learn by mimicking human actions.  M.I.T.’s “Kismet” is a robot that designed to interact socially, by recognizing body language and voice inflection, and it uses lower level computers and lower level actions to mimic basic human automated actions.


The major drawback to AI in robotics is trying to mimic the billions of neurons and their connections that lead to higher level learning in humans, this complex circuitry is incomprehensible to AI developers.  Mostly everything is theoretical right now and science is creating theories and testing them to see if they have figured out the secret to this higher level learning.  So far we are pretty far away from the Authur C Clarke’s version of the future where robots and human are so integrated it enables humans to live hundreds of years.


When it comes to finding a job in robotics it would appear to be much easier, but is also entails more than just the artificial intelligence aspect which is hard to parse out in a job search.  IN the field of robotics, there are currently over 4000 jobs you could find on LinkedIn:


https://www.linkedin.com/job/robotics-jobs/?trk=jserp_search_button_execute


Facial Recognition Intelligence


This kind of technology really fascinates me as you can have it being used with a pair of glasses and observe a persons face and immediately know their name and have access to their Facebook profile.  No one would ever have to worry about memorizing people’s names anymore, imagine how this would work in sales, marketing and networking circles?  You can immediately appeal to anyone’s interests like Facebook does with their advertising algorithms.


Privacy advocates, however, are going to be absolutely against software like this.  Any person can now tell if someone is liberal or conservative, gay or straight, religious affiliation, what sports teams they like, etc…  It could lead to more discrimination or it could bring us closer together as we realize how many things we have in common with another.  Imagine sitting at a bar alone and knowing that the person next to you loves the same sports teams you do, or is a devout Christian?


The software is currently almost as efficient as humans in recognizing faces, and is only less effective by slightly more than .25%!  Eventually this tech could surpass human recognition abilities.  This is the software that Facebook will eventually use in tagging people in photos, that is why when you hover over a photo it magically knows who it is, and it is soon about to become even more magical!


When searching LinkedIn for this type of job I ended up finding gigs for places like salons, so I thought it best to check other web sites and noticed that on Indeed there was a mere 107 total jobs listed there:

http://www.indeed.com/q-Face-Recognition-Engineer-jobs.html


So while the amount of jobs in this industry is very meager right now, you can bet that with its marketing capabilities that it could end up being the fastest growing part of artificial intelligence development out there.


Search Engine Intelligence

  • March 2013: Google acquires DNNresearch, a neural network startup out of the University of Toronto, and gets the team refocused on expanding traditional search algorithms.
  • January 2014: Google acquires DeepMind and sets up the artificial intelligence team to work directly with the Knowledge team on Google’s search algorithms. (They also, almost immediately, set up an AI ethics board — presumably, to save the human race from AI-wrought extinction.)
  • September 2014: Google expanded research surrounding quantum computing by hiring John Martinis and his research team out of UCSB.
  • October 2014: Google acqui-hires two teams of AI researchers from Oxford (and announces a partnership with the University) to “enable machines to better understand what users are saying to them.”

I posted the above listed link from here, just to give an example of how far and ahead Google is over anyone else in using search engine capabilities to create artificial intelligence.  Rumor has it that they already have algorithms that can learn and are readjusting as we speak, hence why they have reduced the amount of announcements they make on their own algorithm discoveries.  Part of that may be due to google switching to SEO’s that are geared more towards fact based accuracy over “hit” based accuracy, but unless you are in google’s top brass there really is no way to know.


Search Engine Optimization (SEO) still seems to be the place to go if you are entering the intelligence industry right now, but it is still very broad as it could range from simply being a key word specialist to being an actual algorithm developer with Google, so be wary of the results below from LinkedIn as they are likely not representative of actual AI jobs:

https://www.linkedin.com/job/search-engine-ai-jobs/?trk=jserp_search_button_execute


Atrificial Intelligence in the defense industry


The description below of quantum computing is taken from NASA’s own website here.

“The NAS facility hosts the Quantum Artificial Intelligence Laboratory, a collaborative effort among NASA, Google, and Universities Space Research Association (USRA) to explore the potential for quantum computers to tackle optimization problems that are difficult or impossible for traditional supercomputers to handle.

The laboratory houses a 512-qubit D-Wave Two™ quantum computer, installed at the NAS facility on the NASA Ames campus. The facility has been extensively retrofitted to provide isolation from noise and vibration, as well as the infrastructure required to cool the system to its near-absolute-zero operating temperature. The installation team recently completed a series of rigorous calibration and acceptance tests, and is planned to be operational in early fall 2013.”

Quantum computing is an exciting area of artificial intelligence.  Theorists say that one day you can turn on your computer simply by thinking it or observing it, as quantum computing approaches further development we get further understanding of how this could actually happen.


As for government jobs in artificial intelligence they don’t seem to use social media as much as other private sector employers would so the jobs available through LinkedIn are fairly limited at just a few dozen or so.


https://www.linkedin.com/job/artificial-intelligence-government-jobs/?trk=jserp_search_button_execute


Overall the field of artificial intelligence is an ever evolving ever developing industry in which the approaches to reaching human like intelligence is happening from many different industries and many different theories and methods.


And as AI develops and becomes smarter it becomes more likely that more jobs will be taken away just as they are created.

Sports, Stats and Science Introduction and Cubs Opening Day

As my first post I thought it best to introduce what I am trying to bring here that may separate me from the thousands of other sports blogs.  When I was a kid I was a baseball card collector and a stats junkie, and now as an adult I am still a stat junkie and now a computer scientists who can use this data to do things I want to do.  So I am going to combine my love of sports, stats and coding on here and hope it can do something for the reader and maybe get me a front office job for a baseball team or other sports team.

I see the Cubs this year and their stadium in the same stage of their building process.  The Cubs are past the transition point of selling off their bad parts and are now in the process of seeing new shiny rookies coming to the plate and dazzling us.  The Cubs stadium is past the process of the rooftop owners blocking their progress and are now in the process of adding shining new toys as well, like that massive scoreboard and really loud speakers.

There are also going to be some ups and downs as both the team on the field and the field itself works out some kinks.  We saw what young guys will look like at times, with Soler having a bad day in the field and being tricked into swinging at pitches outside the box (something he apparently never did in Spring Training).  And at the stadium we saw from the outside a great looking visual dedicated to Banks to cover up the construction and on the inside long lines at the bathrooms and concessions and the concessions running out of hot dog buns.

All in all it was a very exciting experience as I watched the game from my brothers place in Wrigleyville and heard the loudspeakers from as far as half a mile away.  The excitement this year will far exceed my expectations of what I hope to see.  I am not looking for a playoff team, I am simply looking for players to play well, and for some improvements to occur so that we have a playoff team from 2016-2021 and multiple chances to win a World Series.  This team is far from complete as is the stadium but it will bring us the experiences of what may happen in the future and that future could be amazing.

So what I am doing for coding?

I am working with Big Data and Hadoop, which is a system developed by Google to parse through lots of data really quickly.  So the program I am working on is simple just so I can get my feet wet and develop my ability to do things with data that can hopefully land me a front office gig.  My first program will be to take the overall batting average and ERA for both leagues combined since 1871- 2014.  The idea is to see if there is any correlation with batting averages and earned run averages, and see how much it correlates, and eventually do this with many batting categories.  So right now I am done figuring out how to get the averages, so if you are a baseball fan and can’t read code you can start to zone out here, and skip to the bottom.

Here is the Mapper Class, that reads from a comma separated value file and passes to the reducer.  There are comments in the code that show what each line does.

package BaseballStats;
import java.io.IOException;
import java.io.StringReader;

import org.apache.hadoop.io.LongWritable;
import org.apache.hadoop.io.Text;
import org.apache.hadoop.mapred.MapReduceBase;
import org.apache.hadoop.mapred.Mapper;
import org.apache.hadoop.mapred.OutputCollector;
import org.apache.hadoop.mapred.Reporter;

import com.opencsv.CSVReader;
public class StatMapper extends MapReduceBase
implements Mapper<LongWritable, Text, Text, Text> {

private Text Year = new Text();

private Text info = new Text();

public void map(LongWritable key, Text value, OutputCollector<Text, Text> output,
Reporter reporter) throws IOException {
// TODO Auto-generated method stub
//Text being converted to String and set to line

String line = value.toString();

//CVS object created to take in line values through String Reader
CSVReader R = new CSVReader(new StringReader(line));
String[] ParsedLine = R.readNext();
R.close();

//String values being set to Text value.
Year.set(ParsedLine[1]);
//take in atbatss andd hits and put into one value
info.set(ParsedLine[6]+”,”+ParsedLine[8]);

output.collect(Year, info);
}
}

Here is the reducer Class, that takes atbats and hits and the year and creates a league average for that year:

package BaseballStats;
import java.io.IOException;
import java.util.Iterator;
import java.util.Map;
import java.util.TreeMap;
import java.util.regex.*;

import mrtools.CountMap;

import org.apache.hadoop.io.Text;
import org.apache.hadoop.mapred.MapReduceBase;
import org.apache.hadoop.mapred.OutputCollector;
import org.apache.hadoop.mapred.Reducer;
import org.apache.hadoop.mapred.Reporter;

public class StatReducer extends MapReduceBase implements Reducer<Text, Text, Text, Text> {

public void reduce(Text key, Iterator<Text> values, OutputCollector<Text, Text> output, Reporter reporter) throws IOException {
// TODO Auto-generated method stub

float AB = 0;
float H = 0;

while (values.hasNext()) {
//take in value and split it into two ints
String v[] = values.next().toString().split(“,”);
int atbats = 0;
int hits = 0;
try {
if (Integer.parseInt(v[0]) != 0 && Integer.parseInt(v[1]) != 0) {
//need to take items from array and setting as ints
atbats = Integer.parseInt(v[0]);
hits = Integer.parseInt(v[1]);
} else { continue; }
} catch (ArrayIndexOutOfBoundsException | NumberFormatException e) { continue; }
//totalling atbats to year value
AB = AB + atbats;
H = H + hits;

}
if (AB != 0 && H !=0){
//division to create batting average
float average = (H/AB);

Here is the driver that starts the program:

package PitchingStats;

import java.io.IOException;

import javax.xml.soap.Text;

import org.apache.hadoop.fs.Path;
import org.apache.hadoop.io.LongWritable;
import org.apache.hadoop.mapred.FileInputFormat;
import org.apache.hadoop.mapred.FileOutputFormat;
import org.apache.hadoop.mapred.JobClient;
import org.apache.hadoop.mapred.JobConf;

public class CountJob {
public static void main(String[] args) throws IOException {
JobConf conf = new JobConf(CountJob.class);
conf.setJobName(“Batting Average”);

conf.setOutputKeyClass(LongWritable.class);
conf.setOutputValueClass(Text.class);
conf.setMapOutputKeyClass(Text.class);
conf.setMapOutputValueClass(Text.class);

conf.setMapperClass(StatMapper.class);
conf.setReducerClass(StatReducer.class);

FileInputFormat.addInputPath(conf, new Path(args[0]));
FileOutputFormat.setOutputPath(conf, new Path(args[1]));
JobClient.runJob(conf);

}
}

The output of this code looks like this:

1988    0.255
1989    0.255
1990    0.259
1991    0.256
1992    0.256
1993    0.266
1994    0.271
1995    0.268
1996    0.271
1997    0.268
1998    0.267
1999    0.272
2000    0.271
2001    0.265
2002    0.262
2003    0.265
2004    0.267
2005    0.265
2006    0.270
2007    0.269
2008    0.265
2009    0.263
2010    0.258
2011    0.256
2012    0.255
2013    0.255
2014    0.252

I included these years because you can clearly see where the steroid era kicked in.